Working on a microcontroller usually means squinting at the board. You can’t take a screenshot of it, and you can’t see how fast it runs without setting up a debugger. Deki 0.18.2 closes some of that gap: the board answers a few requests over the same USB cable you flash it with, and the editor knows how to ask.
A screenshot of the board
The editor can save the frame a connected board has on its screen as a PNG: the real framebuffer, read back over USB, checked so a bad transfer is caught rather than saved. It takes about a second, and the game does not count that second, so nothing timed jumps ahead afterwards.
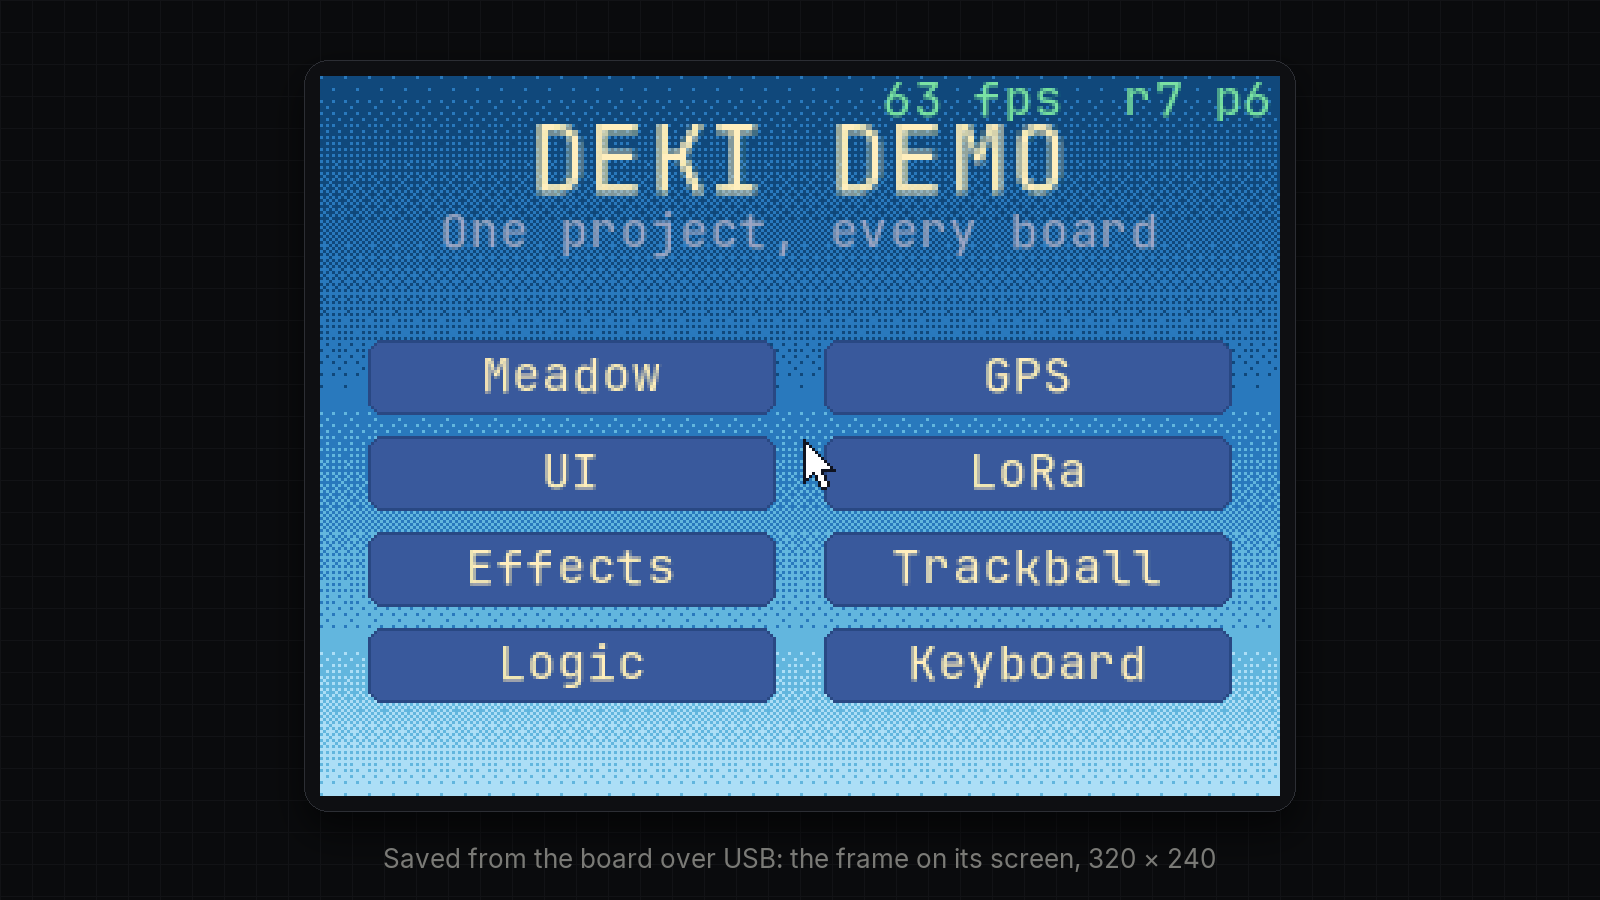
It is the quickest way to tell whether a glitch you see on the panel is in the frame the engine drew or happens on its way there.
How fast is it running
Ask the board and it reports its frames per second, how long an average frame spent updating, rendering and sending, and how much memory is free. For more detail it can break the render time down per component type, and it can open any scene on request, so one script can measure them all. That is how the 60 fps work was measured.
Less to set up
- The port finds itself. A flash with no port named picks the only serial port there is or, with several, the first that answers as an ESP32.
- Build output where you are. A build or flash shows its output and how it ended in the editor’s Activity panel, and a failed asset export says which assets.
From a script, or an agent
All of this is also on the editor’s MCP server. Point an agent at a running editor and it can build the firmware, flash the board, open a scene on it, read the frame rate and look at the screen, with no one in between. Most of this release’s device work was done in exactly that loop.
The requests are plain lines of text on the serial port, so anything that can open one can use them too. They work on any ESP32 board whose console is the chip’s own USB port or a UART.